

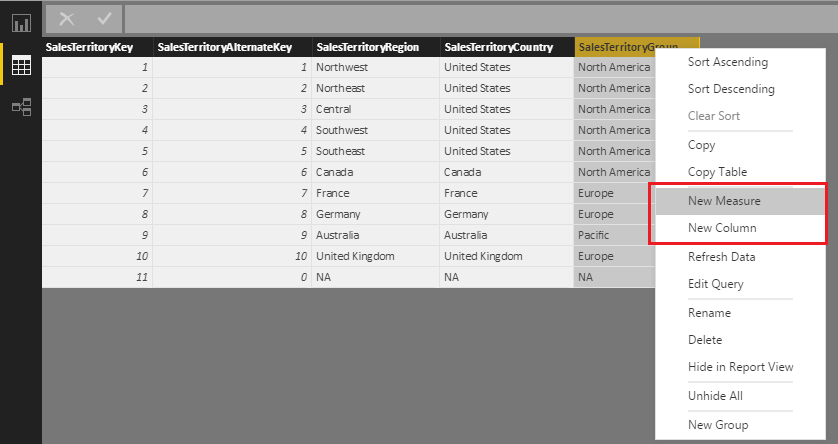
We can create two types of new values using DAX in Power BI. They are calculated measures and columns. Difference between measure and column and its understanding is another major step in order to understand DAX language for Power BI. New measure or column in Power BI is added by clicking right mouse button above any column. Then select New measure or New column (as seen in the picture).
Column – adding new column into which is later inserted the DAX formula results in the formula being processed on the table level row by row. All column values get summed up on the report level. Created column can then be seen directly in the table.
Measure – The effect is different with measures. We do not see it by the table as a new column but as a field in the selection below the table. In report, the measure is calculated on the report level in the context in which we display it.
Difference Measure vs. Column With Report Example
This table should help to understand the difference. We will work with these tables during the demonstration.
- Sales (FactInternetSales)
- Teritories (DimSalesTerritory), in which the sales occur – geographical information on sales. Meaning where the sales took place.
- Calendar (DimDate), contains dates and information such as month, year etc.
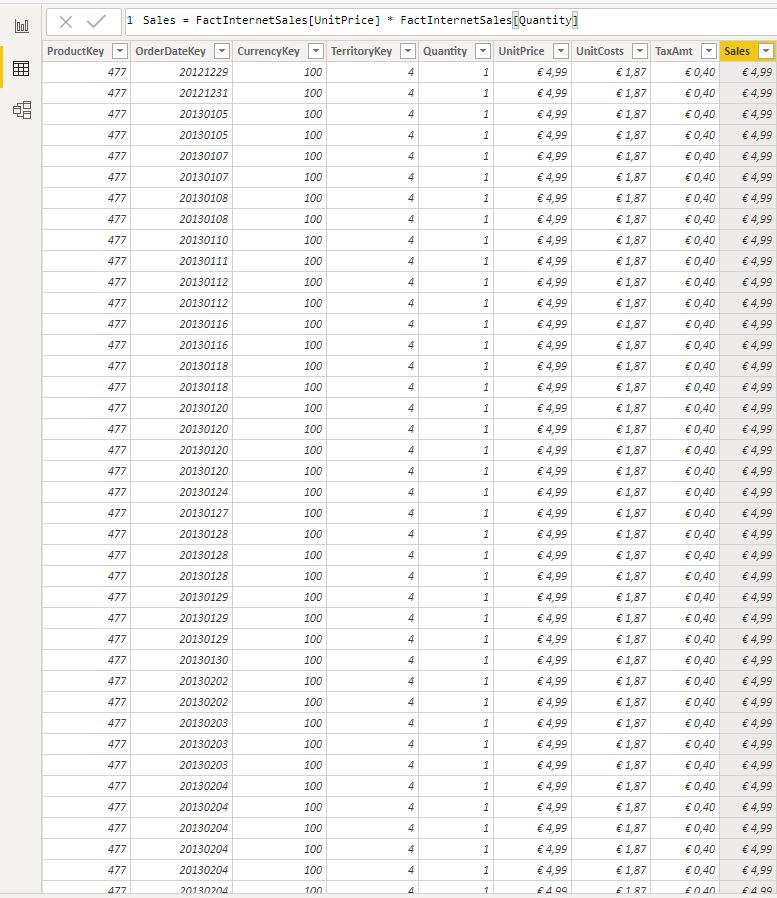
Step 1) Add new column with total sales into the table with sales (price * amount). It already contains individual item prices, production costs and sold amounts.
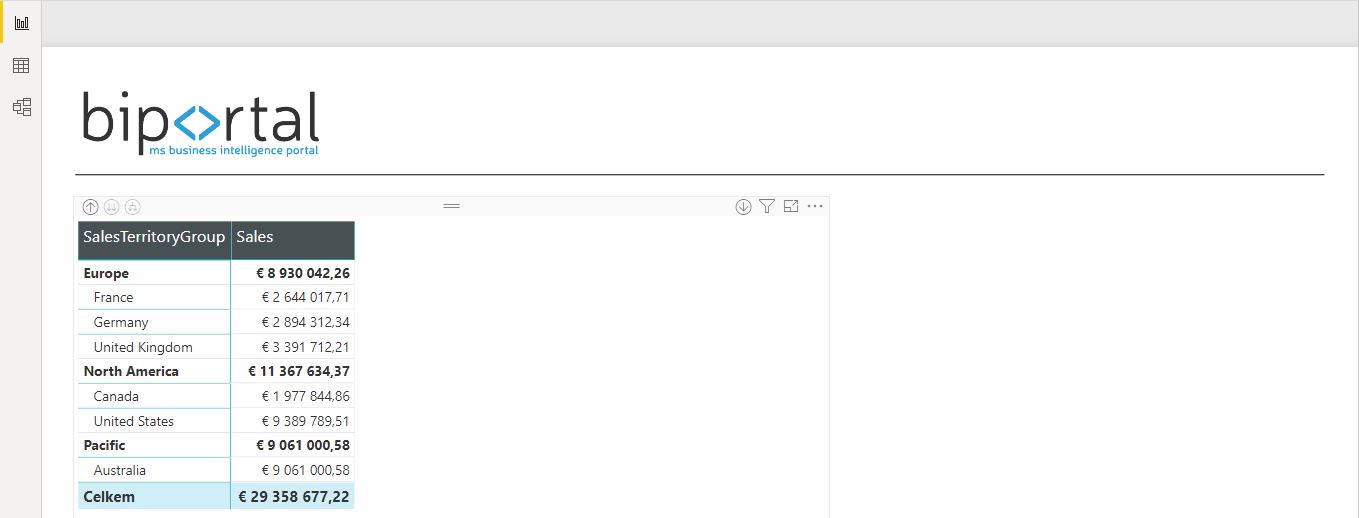
Step 2) We will create simple power bi visualization where I will display running result. Sales will be displayed by territory.
Step 3) We will now illustrate the difference between measures and columns. First, add a new column via DAX formula (as in picture below). It will show ratio of unit costs and unit price = UnitCosts/UnitPrice . Then display the result in report.
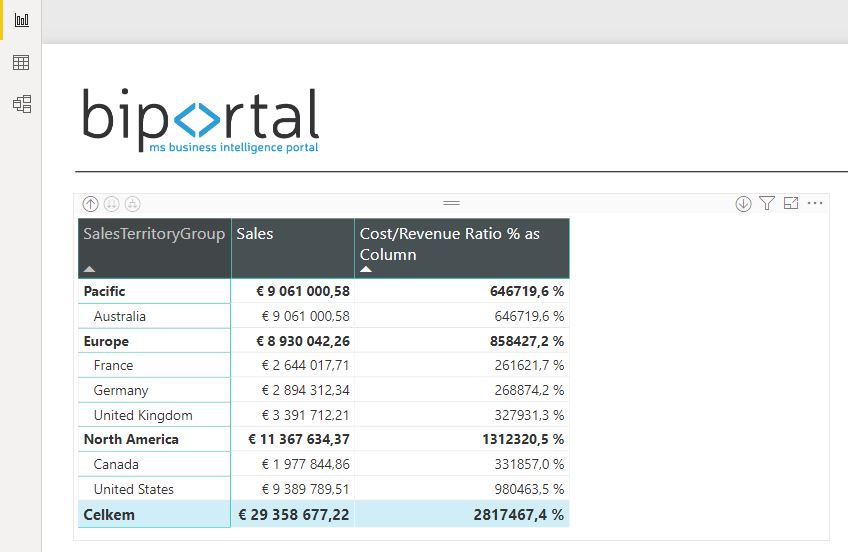
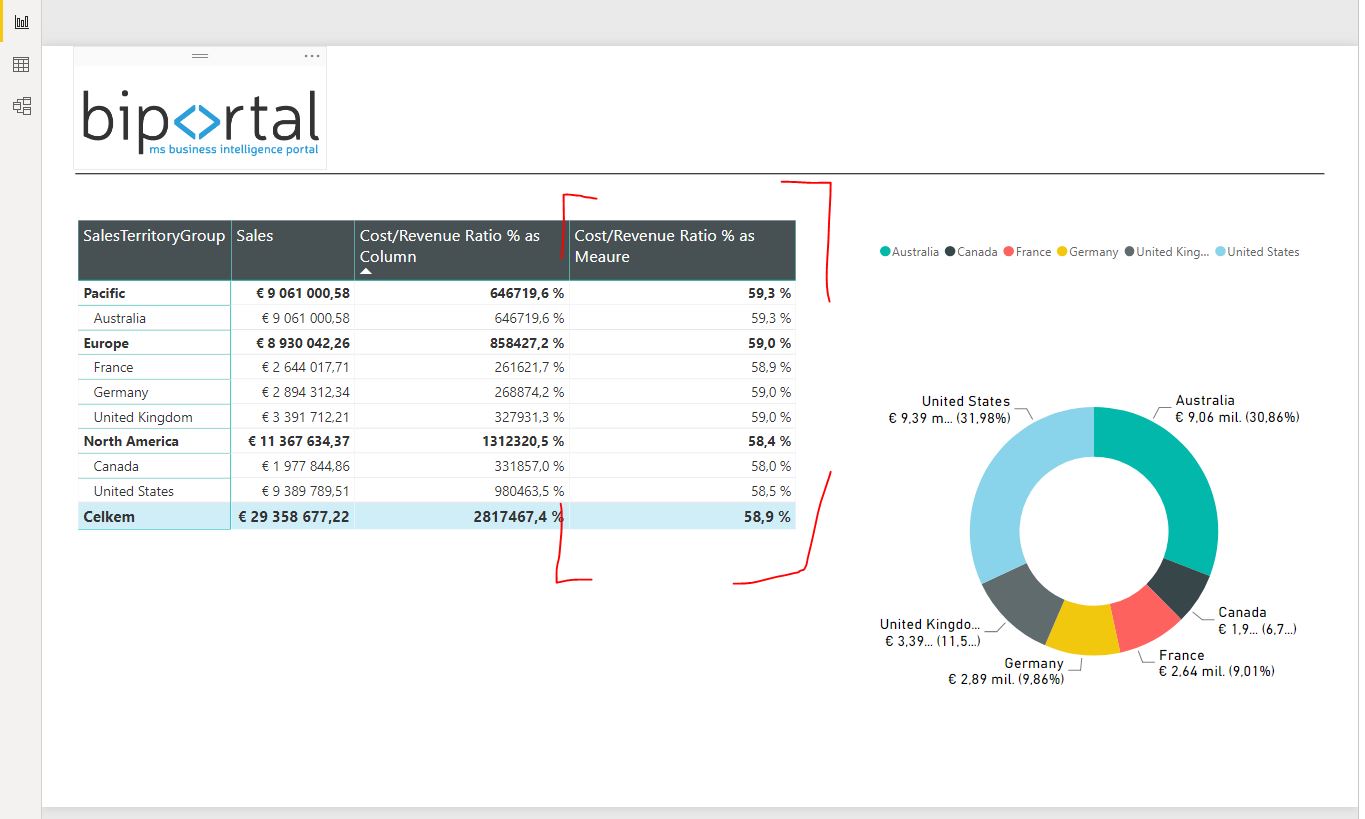
The result is nonsense (as in the picture) – what happened is that percentage shares got counted up throughout all rows
Step 4) We need to create not a new column but a DAX measure in order to get the report working correctly. Measure is calculated all the way at the report level. Formula for the measure will be similar only with the exception of aggregate function usage. Costs and price ratio – SUM(UnitCosts)/SUM(UnitPrice). The result is exactly as we need it.
I hope that the difference between measure and column in creating new values was explained well enough.