Power BI Gateway – Introduction Into Tool For Report Refresh/Update
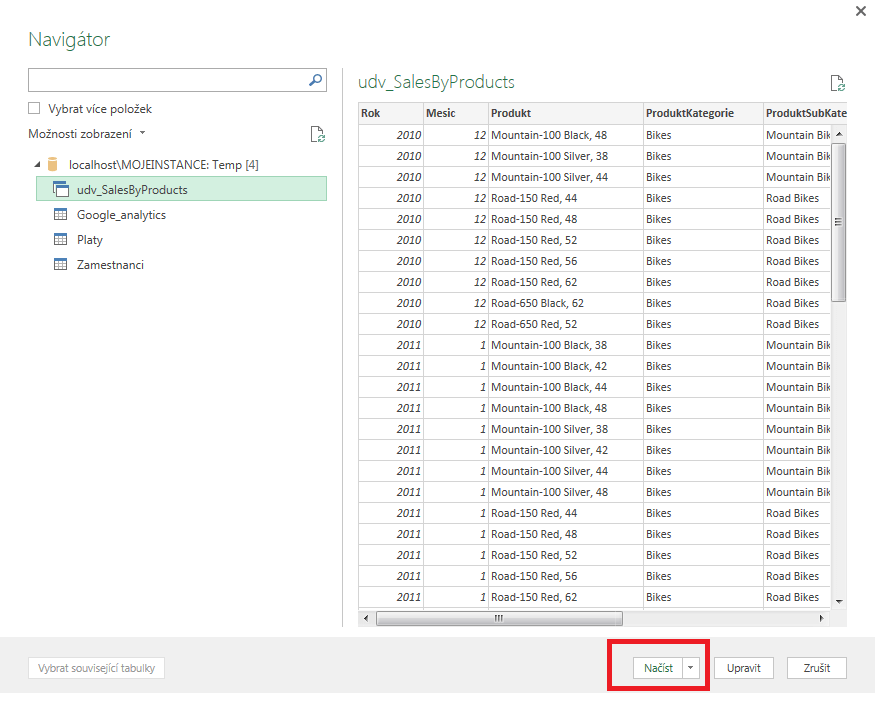
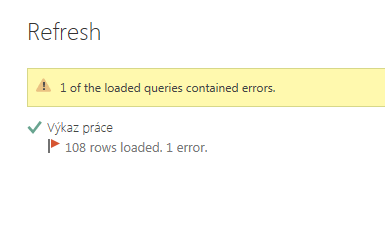
It is nothing hard to create report using Power BI desktop for example from Excel and then upload it to the cloud on powerbi.com. But how to update the cloud data when the source file is located on your PC/server and “the cloud service does not see the data”? One of the ways is to… Read More »