

Were you ever creating a report and did not find a feature in your Power BI Desktop that would enable you to visualize data according to your needs?
What are Power BI Custom Visuals?
Custom Power BI visuals were created by members of power BI community – programmers, users, and fans of this wonderful tool. If you are a developer then you have a possibility to contribute a visualization to the list. It is a great form of advertising your company or yourself directly. It can definitely bring new customers to you in the future. There is a gallery of custom visualizations on powerbi.com here
I found a visual I was missing in Power BI – Timeline. I use it as a time period filter in reports working with time context.
Power BI Custom Visuals Examples
Everyone has their own needs. You can definitely find visuals worth installing. Some visuals do not seem of much use on the other hand.
Timeline: Timeline is my number one now. It substitutes something I am really missing in basic power bi desktop.

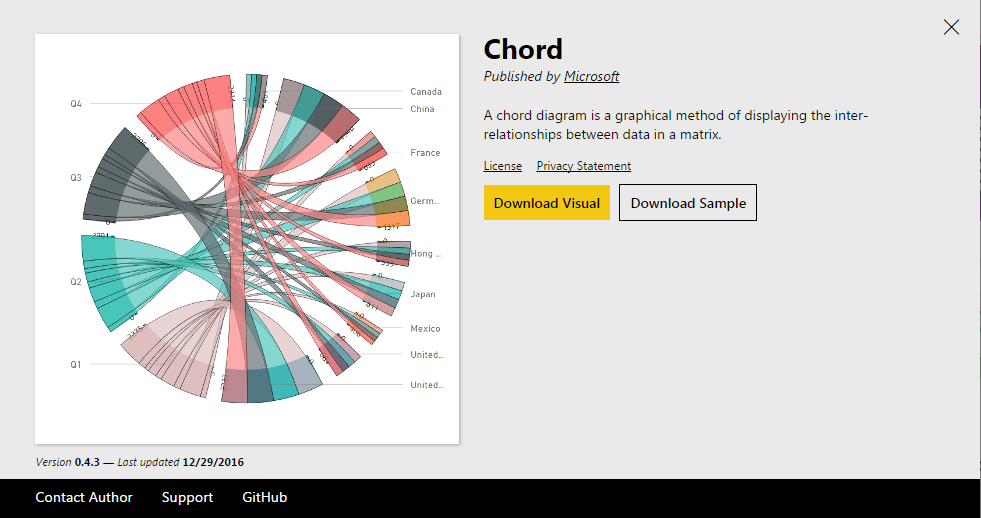
Chord – I must admit I did not use this visual yet. But it is highly rated. Author is Czech – Radim Hampel from Intelligent Technologies
Pulse Chart – For presenters – powerpointers I have big something here – business intelligence tweak which will for sure impress. Pulse chart is visual featuring chart that renders with time. You can insert some event in some point of the chart on which will the rendering stop. Ideal for presenting financial graphs of performance company and for graph peak explaining. 🙂
I pointed out only couple of power bi visuals. There is more of them deserving your attention. Take a look at it, they will definitely catch your eye.