Aggregate functions in DAX language are used to get certain summarized or grouped data view. Thanks to this, we can edit high detail data in a certain column into more simple and reportable form using aggregation. We can for example sum up (SUM, SUMX) some financial metrics by individual category or express maximal/minimal (MAX, MAXX, MIN, MINX) value using categories.
List of Aggregate Functions in DAX
Functions can be divided into 2 categories. There is a difference from Excel in DAX for Power BI and PowerPivot. Some functions in DAX have an equivalent function ending in “X“. These functions were explained in article SUM vs. SUMX.
1) Standard functions: <column> is the most accepted parameter. This does not count for COUNTROWS where the parameter is <table>. These functions perform aggregation always with the whole column.
- SUM – sums up values in given column
- COUNT – count of numeric values in given column
- COUNTA – count of not-empty values in a column including text
- MAX – returns maximal value in given column
- MIN – returns minimal value in given column
- AVERAGE – average of values in given column
- AVERAGEA – works identically to function AVERAGE but it processes also non-numerical characters
- COUNTBLANK – sums up all empty values in a column
- COUNTROWS – number of rows in a table. It is mostly used in combination with function FILTER.
2) X Functions: These function accept table and expression <tabulka>, <expression> as a parameter. Then iterate row by row in given table. Their meaning is same to those mentioned above.
- SUMX
- MAXX
- MINX
- COUNTX
- AVERAGEX
- COUNTX
DAX Aggregation On An Example of Power BI Report
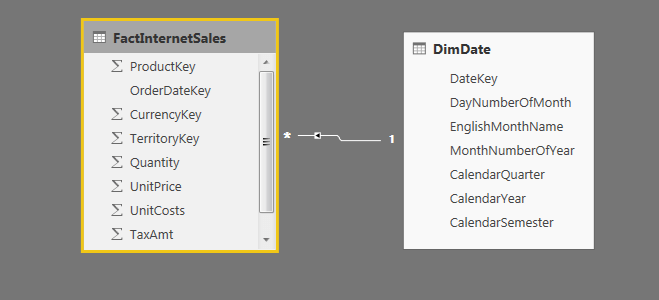
I will use my previously created Power BI laboratory again for this demonstration. I will be working with 2 tables – Sales (FactInternetSales) and Calendar (DimDate) – as in model.
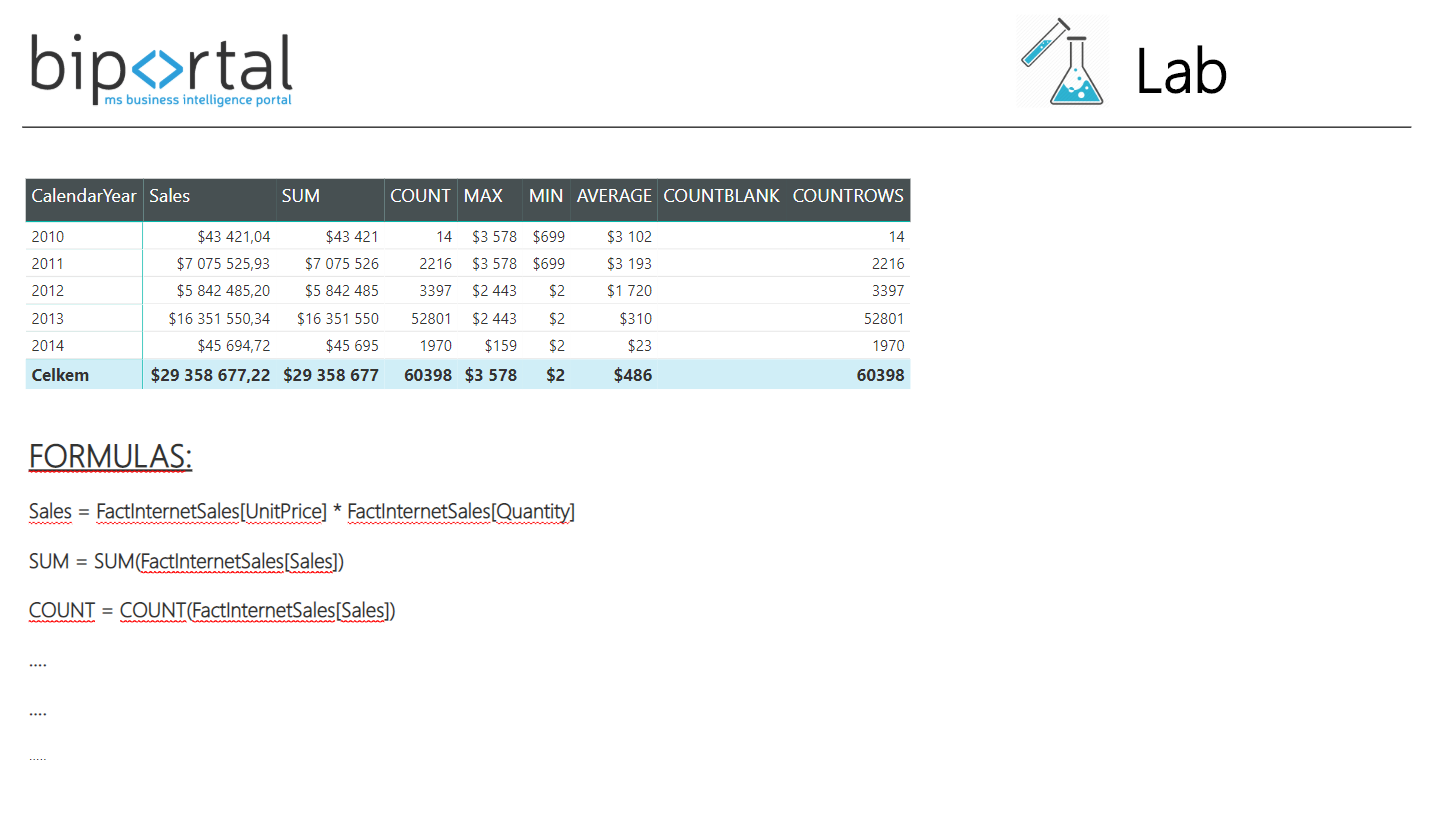
I will then create metrics using standard aggregate functions and let it display in the report.

