You probably noticed that there are many functions in DAX that are similar to Excel ones (as in article here). Contrary to Excel functions, DAX haves on strange thing. Some aggregate functions have another similar function ending with X – for example SUM and SUMX or COUNT and COUNTX.
These functions often give same results but it is not easy to identify the difference at first sight. We have a little Hamlet question here.
Aggregate Functions – Aggregators (SUM) and Iterators (SUMX) in DAX
SUM and SUMX are aggregate functions performing addition (measures). We can divide it further in DAX into 2 sexy-sounding categories – Aggregators and Iterators. Meanwhile, SUM (and her sisters COUNT etc.) belongs to category of so called aggregators, SUMX is in DAX iterator. What does that even mean?
DAX Function SUM as Aggregator
All aggregators including SUM perform aggregation through the whole columns. If we take a look at the syntax of the function, we can see that the argument of the function is always just one parameter – <ColumnName>.
It means that it is not possible to enter any expression into the function argument. You cannot, for example, perform SUM(X*Y). It is always aggregation of some column.
DAX Function SUMX – As Iterator It Is Aggregating Row After Row
SUMX is a function of multiple uses. X functions are called iterators because they do not react to the whole column as for example SUM. They iterate by each row. Furthermore, the function can accept expression as an argument. Let’s take a look at syntax:
SUMX([Table]; [Expression])
The argument of the function is table and expression (can be column or expression). Since the function does accept expression and iteration goes by each row of the table, the function offers 2 advantages:
- if we want to report from the table where the measures must be calculated, we do not have to create new column (calculated column). We can use SUMX directly
- Thanks to expression, new opportunities arise concerning operations of condition type (filters) etc.
The function haves 1 major disadvantage – since it is iterating, it is much more slower than its colleague SUM. It is sensible to use SUMX only in cases when it is really needed.
Comparing SUM and SUMX on Example in Power BI
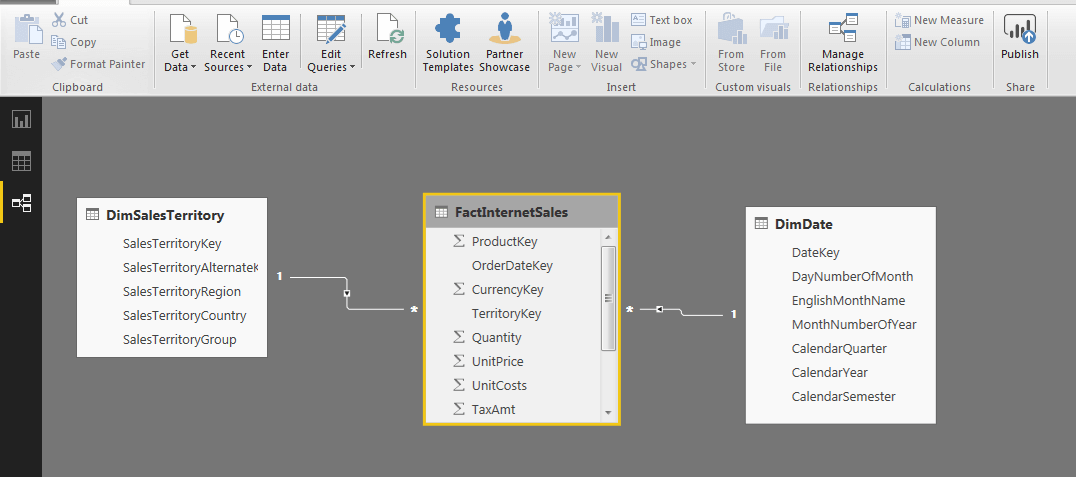
Let’s take a look on a couple of formula examples of both functions directly in Power BI. We will work in environment with 3 tables (Sales, Territories and Calendar).
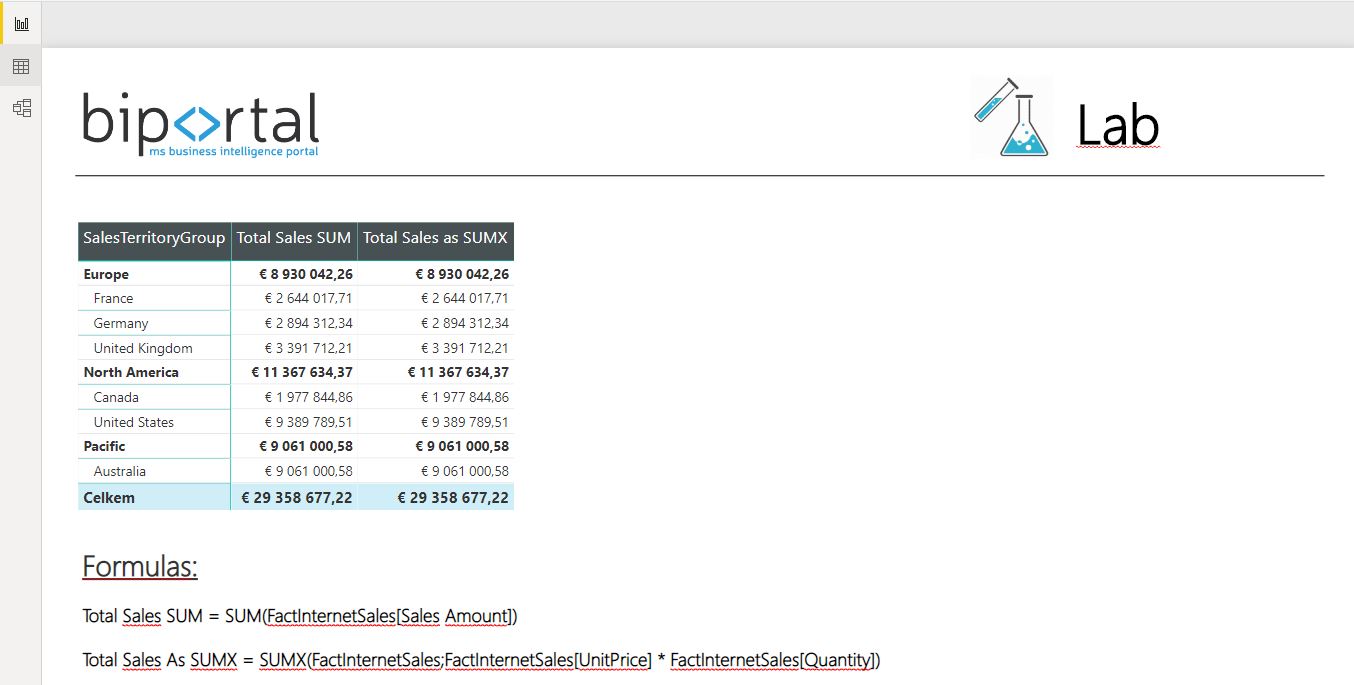
FactInternetSales contains information on new product sales, their unit price, expenses and quantity. I will create 2 new measures in table FactInternetSales and visualize the result by displaying sales through territories.
- Total Sales SUM = SUM(FactInternetSales[Sales Amount])
- Total Sales as SUMX = SUMX(FactInternetSales;FactInternetSales[UnitPrice] * FactInternetSales[Quantity])
Only difference between the functions so far is that I could perform addition in SUMX using expression FactInternetSales[UnitPrice] * FactInternetSales[Quantity]. Other than that, the result is same.
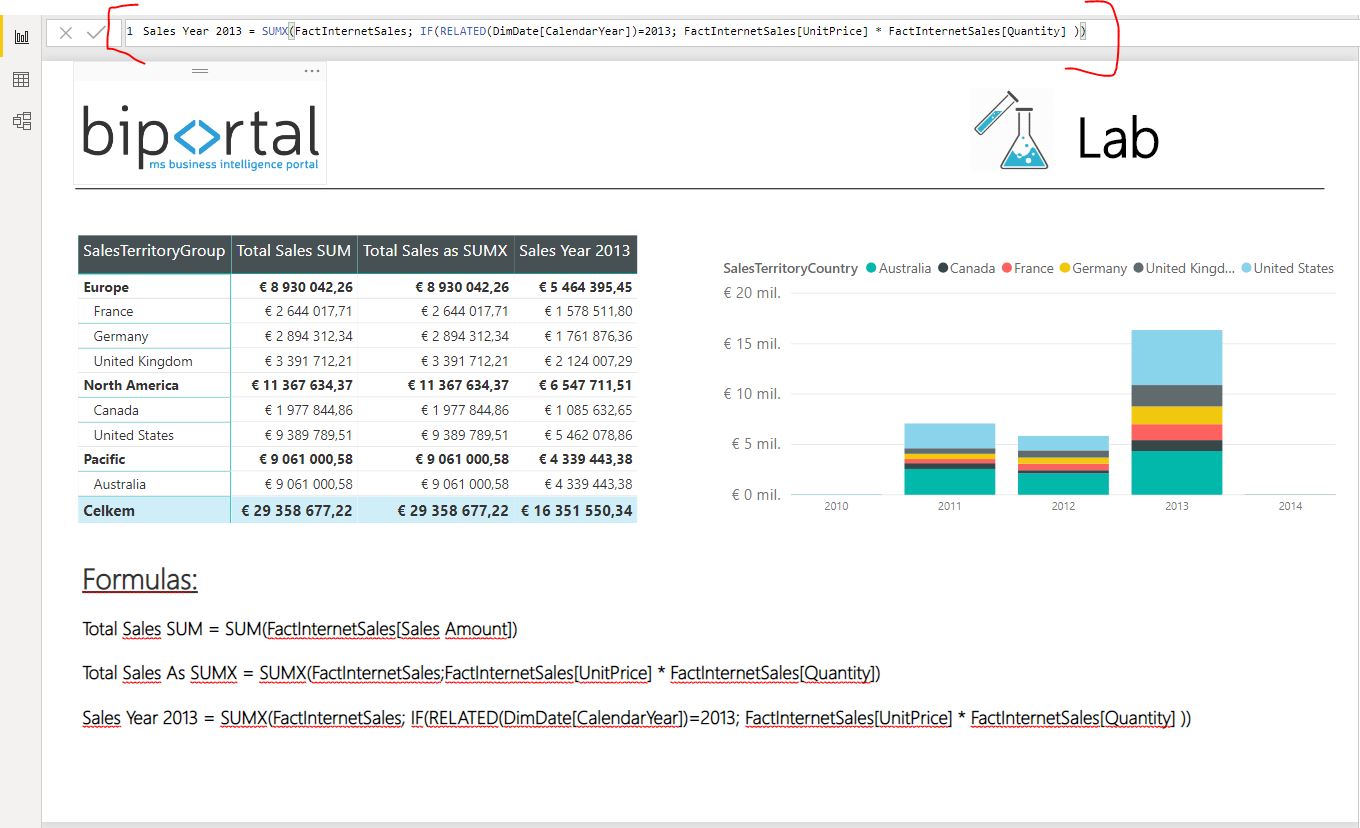
We will add another column [Sales Year 2013] – and that is exactly the situation where it is needed to use SUMX function. I want to display only sales from the year 2013 and I condition aggregating by that (as in the formula in the picture). Sales not fulfilling the condition are not in the total.


