Powerpivot is an excel add-in enabling data modeling and analysis in familiar Excel environment which is certainly an advantage.
Import big amounts of data through Power Query and connect them to each other using PowerPivot
One of the upsides of power pivot is possibility to connect multiple data sources into one excel. It even do not need to be sources of same type. You have choice of multiple data sources:
- Relation databases (Server, Access, Oracle, Azure, Teradata and more)
- Multidimensional sources (Microsoft Analysis services)
- Data channels (Reporting services, information channels)
- Files (Excel, txt)
Individual sources can be connected to each other and in case you are not satisfied with current data structure you can edit it via power query.
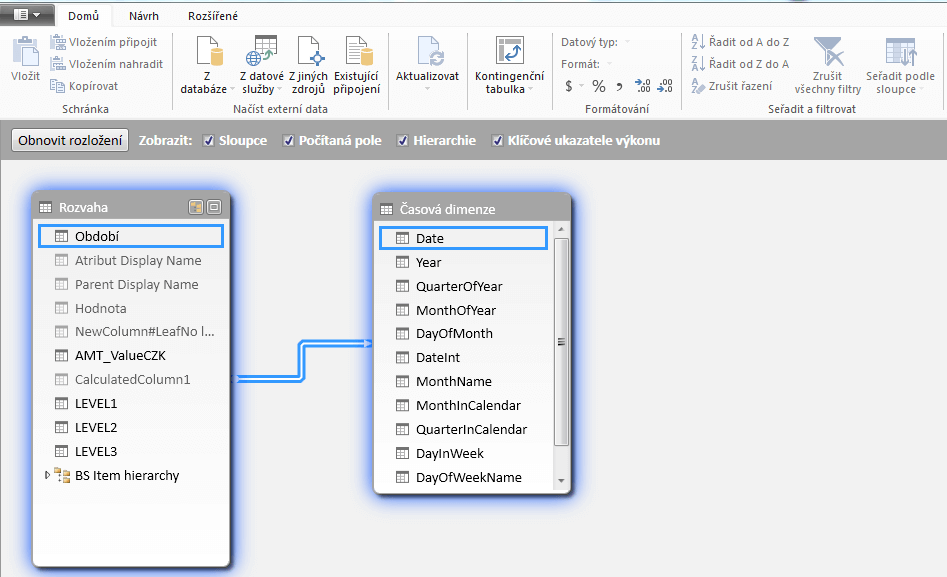
Put data into context by creating data model
- Put your data into context by creating relations between them. If you want to report your sales for example, you can add customer info, history of rates and chronological context.
- Create your own column with calculated values
- Create hierarchy (chronological, accountant etc.)
Created solution is only one-off. If you save excel and refresh it after a while, Powerpivot model will load data from source files and you will have everything up to date again. You do only one job at a time.
Screenshot below is for now in Czech, sorry. I’ll fix it soon
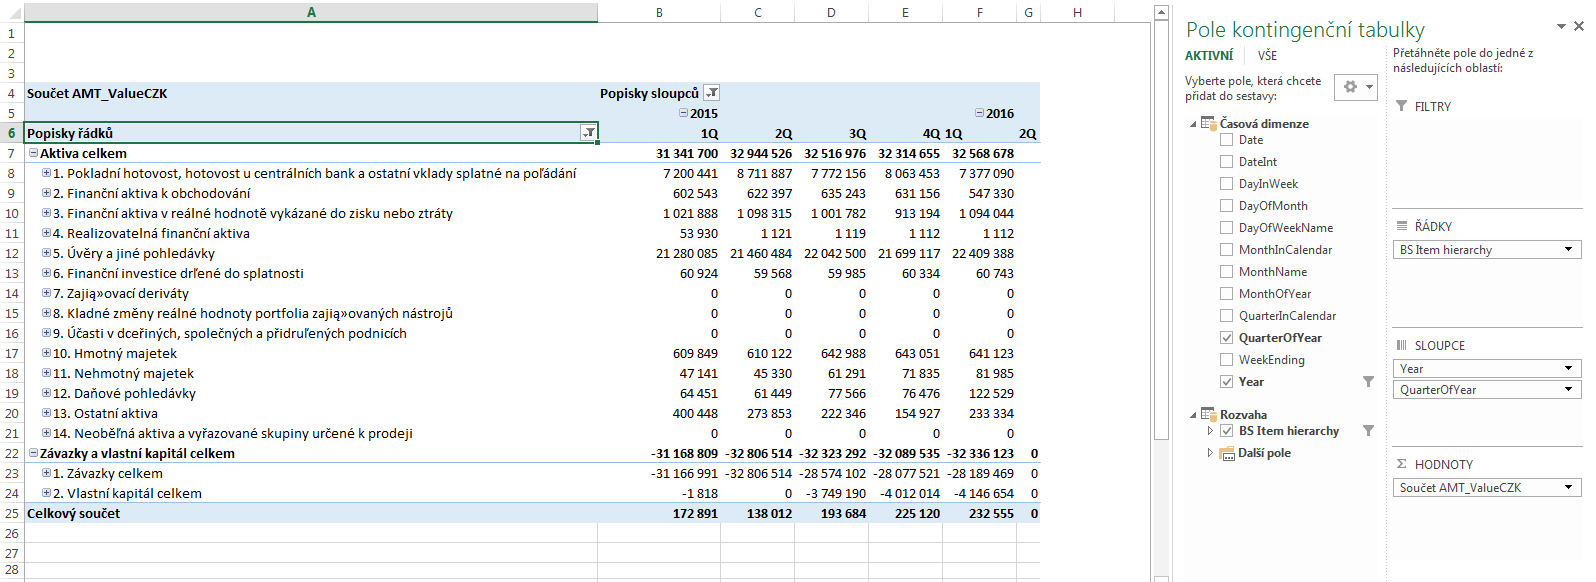
Final Power Pivot report – breathe life into the data
Present data and created context in pivot tables graphs in a way you are used to. No need to control complicated business intelligence tools.
Screenshot below is for now in Czech, sorry. I’ll fix it soon
You can use this tool to work with data in a way previously possible only with specialized database SW

