

1 Zero Investment
Power BI uses so-called freemium model strategy. This means you can use Free version with some limitations but this will not be any problem for the majority of use cases.
2 Visually Perfect Reports
Reports look good and can be made fast and easily. Take a look at some of the reports on this web. Everything is simple and intuitive. You will not have a thing to do in 10 minutes time.🙂 You can set automatic updates of data for the reports using Power BI Gateway.
Demonstration of a simple Sales report created in just a few minutes. You can report from Excel as easily as from a database.
Power Bi reports are interactive which is a great advantage. Managers and analytics can analyze data and trends visually.
3 Many New Data Connectors
Service offers wide specter of connectors for different data sources including SSaS, for example: Dynamics, Salesforce and Google Analytics e.g.:
- Files: Excel, CSV, XML, Text, Folder
- Database: MS SQL Server database, MS Access, SQL Server Analysis Services database, Oracle database, IBM DB2 database, MySQL database, Postgress SQL database, Sybase database, TeraData database
- SSaS, Others: MS Sharepoint, Odata Feed, Hadoop (HDFS), AD (Active Directory), MS Exchange, Microsoft Dynamics CRM, Facebook, SAP Business Objects BI Universe, SalesForce Objects, ODBC, Blank query
If your company uses CRM Microsoft dynamics 365, Salesforce and others, users can simply connect to CRM account and report the data.
Marketers will appreciate possibility of direct connection and reporting from Google Analytics. Analytics and financial controllers will on the other hand appreciate possibility of connecting to SQL databases.
If you rather edit your data in excel before reporting, it is not a problem. Prepare and load your tables into Power BI after editing – there is a plenty of possibilities how to get the data into the report.
4 Power BI Community Helps Each Other
This tool is out there for quite some time and new community members appear every day. Users, programmers and bloggers. All of them are there to help you if you need it.
In most of the cases, the problem as already been solved by someone else before. Some sources claim that the community has had 5M users in 2017 and over 200 000 organizations use it. Google shows uncountable amounts of search results for Power BI community.

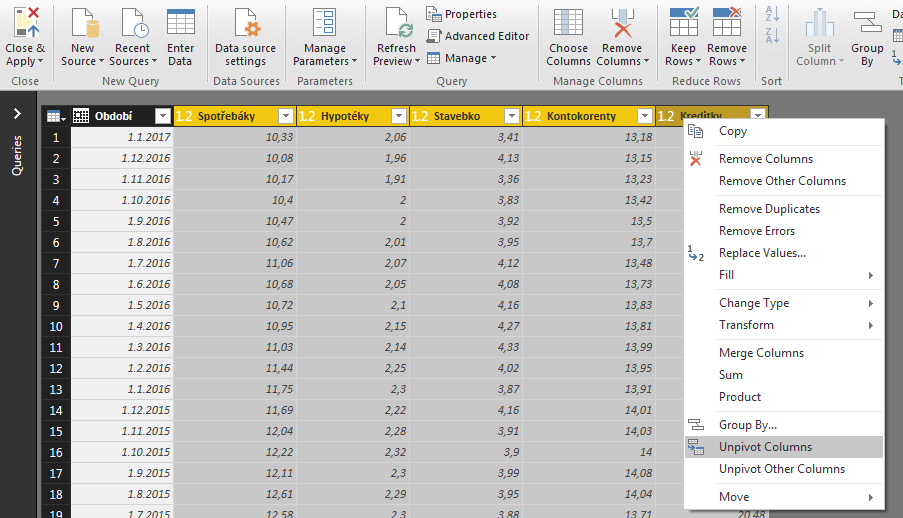
5 Data Transformations Before Reporting
Is the data structure of a data source unsuitable for reporting and are you tired of editing the data in Excel? No problem, Power BI consists of really well-made system enabling user to work with data prior reporting and edit/transform them to look as you want it to.
It also remembers all steps of editing and is able to repeat those steps after every report update. Therefore you can be sure that you will edit the data only once and not after every report update.
6 Report Sharing
You can share created reports with others from your account via email.
Other report sharing possibility is to generate iframe. It can be pasted for example to web pages or by link to report which can be sent to anybody via email.
7 Sufficient Data Store Capacity
You have free data capacity of up to 1 GB for data files/user. That is absolutely sufficient for most of the reports.
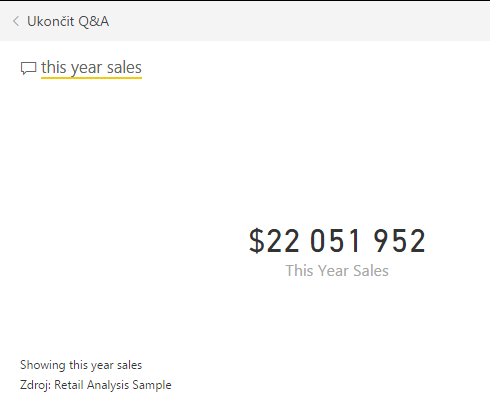
8 Ask anything using Q&A feature and you will get the result
You can use an interesting function called Natural query language – you will ask a question on the dashboard level e.g. “This year’s sales” and the Q&A will answer.
9 Power BI Desktop Application For Easy Report Production
Using this app installed on a client (your pc) you can prepare reports and deploy them to cloud service. PowerBI desktop can be downloaded after logging into your Power BI account.
10 Mobile reports
Access to your dashboards on mobile devices is used by native apps for iOS, Android and Windows using special app Power BI for mobile.
(!!!) Update 7.5.2017 – Power BI free is expected to have some changes. For more info visit article Power BI Premium – Free Version users can cry