

I finally got to MS SQL Server 2016 – Release candidate 3 installation during weekend. First thing I did was focusing on news regarding Reporting services 2016. Microsoft presents its new reporting services as a big thing full of innovations. It looks attractive, sorted and when you look closely you can see resemblance to Power BI (visualization, web portal UI).
Hardware and software requirements are here
Reporting services 2016 Web Portal
There is plenty of news. The most notable one is probably the new web portal replacing manager from the older versions on address domain/instance by default.
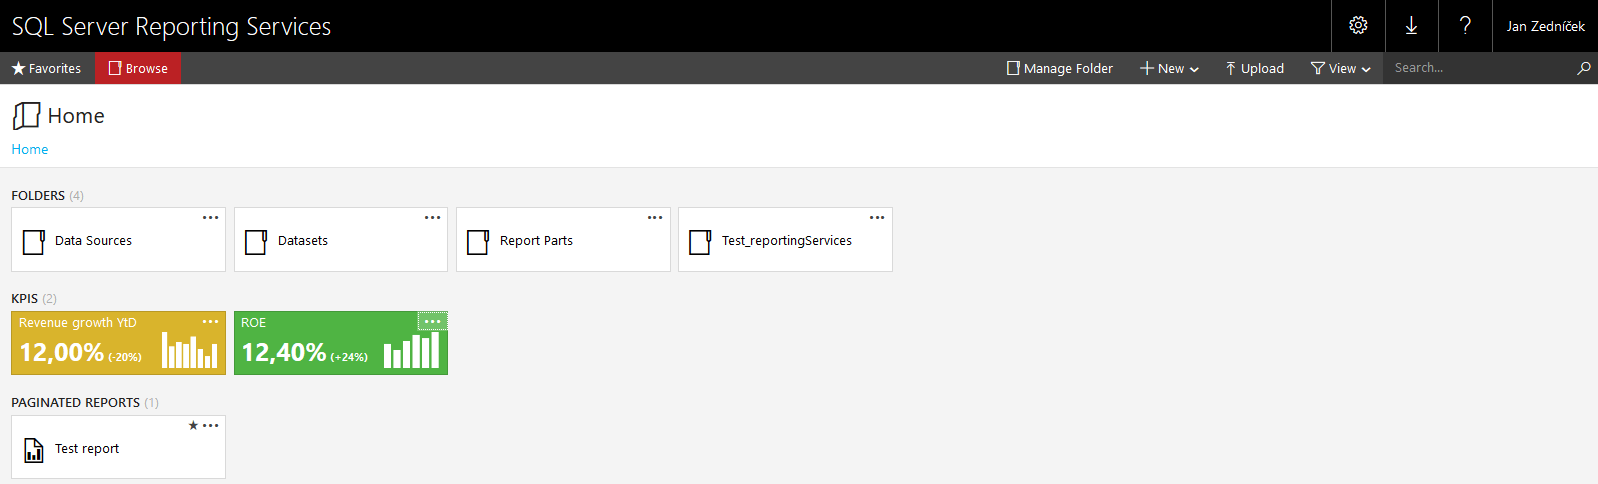
SSRS 2016 web portal
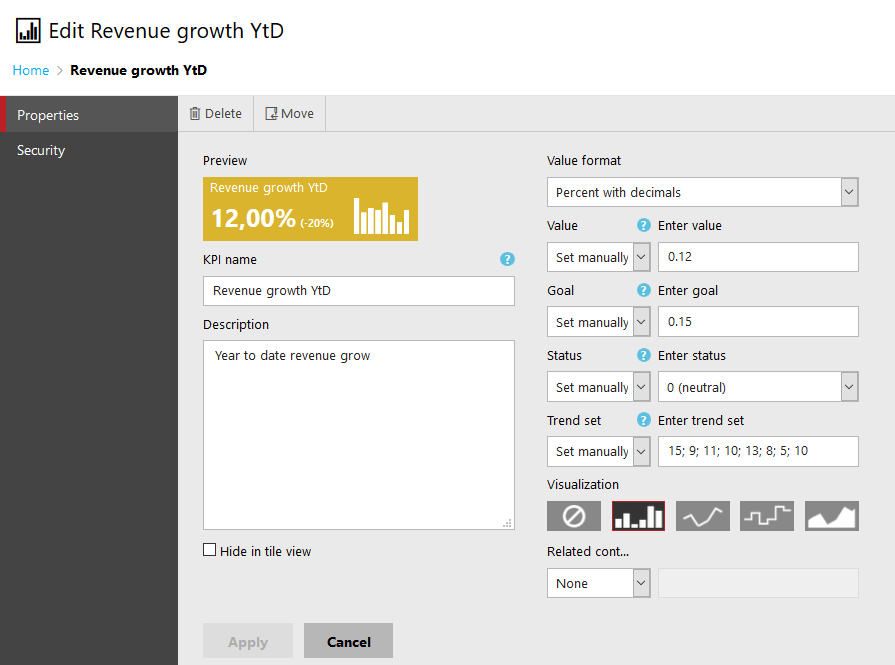
Web portal is used to store reports, shared datasets and data sources. From now on we can also define KPIs and mobile reports. KPIs are created directly in web interface and we can enter them manually. We can also bind them to a prepared dataset thus making KPIs dynamic values that change automatically. KPIs are being used in mobile reports where managers have instant access to all important metrics which are also well organized.
In right upper corner of web interface, there is a possibility to download software needed to produce reports.
- Report builder
- Mobile report publisher
- Power BI desktop
- Power BI mobile
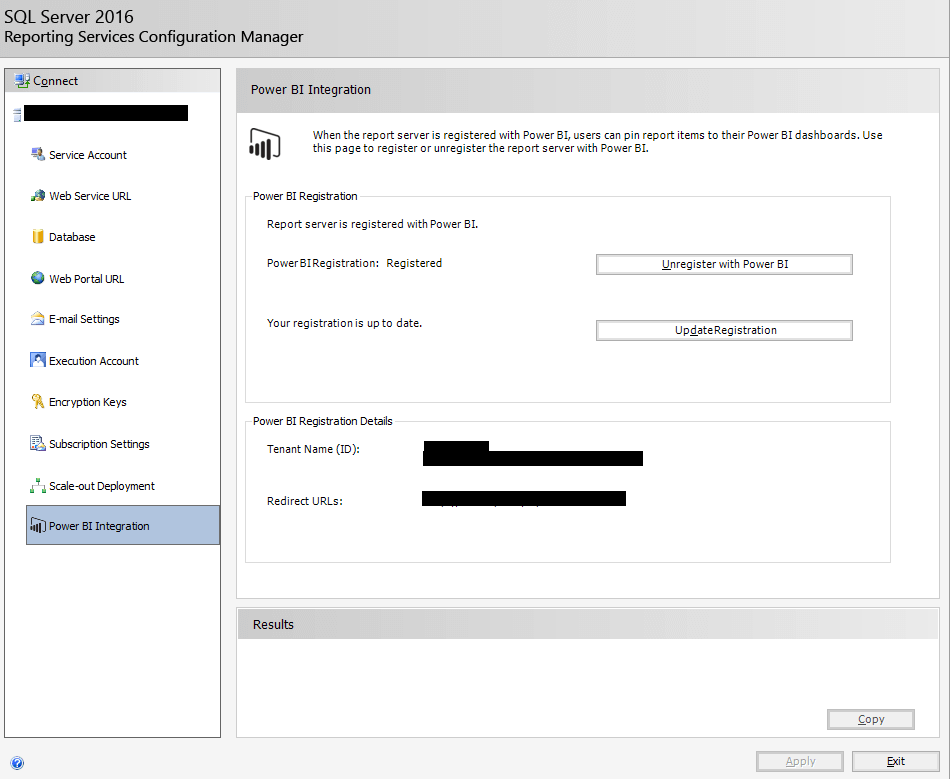
Integration with Power BI Service
Reporting services 2016 is able to integrate – pin some parts of reports into Power BI dashboards. By doing that it uses full potential of SSRS (variability) and power bi (perfect visualization and interactivity) reports. All you need to do is:
- register report server with Power BI in report configuration manager
- Prepare report (either via report builder or Data Tools) – I made a small sales report using connection to freely downloadable SQL database Adventureworks which I installed to SQL server 2016 Release candidate 3 (will test it as soon as possible)
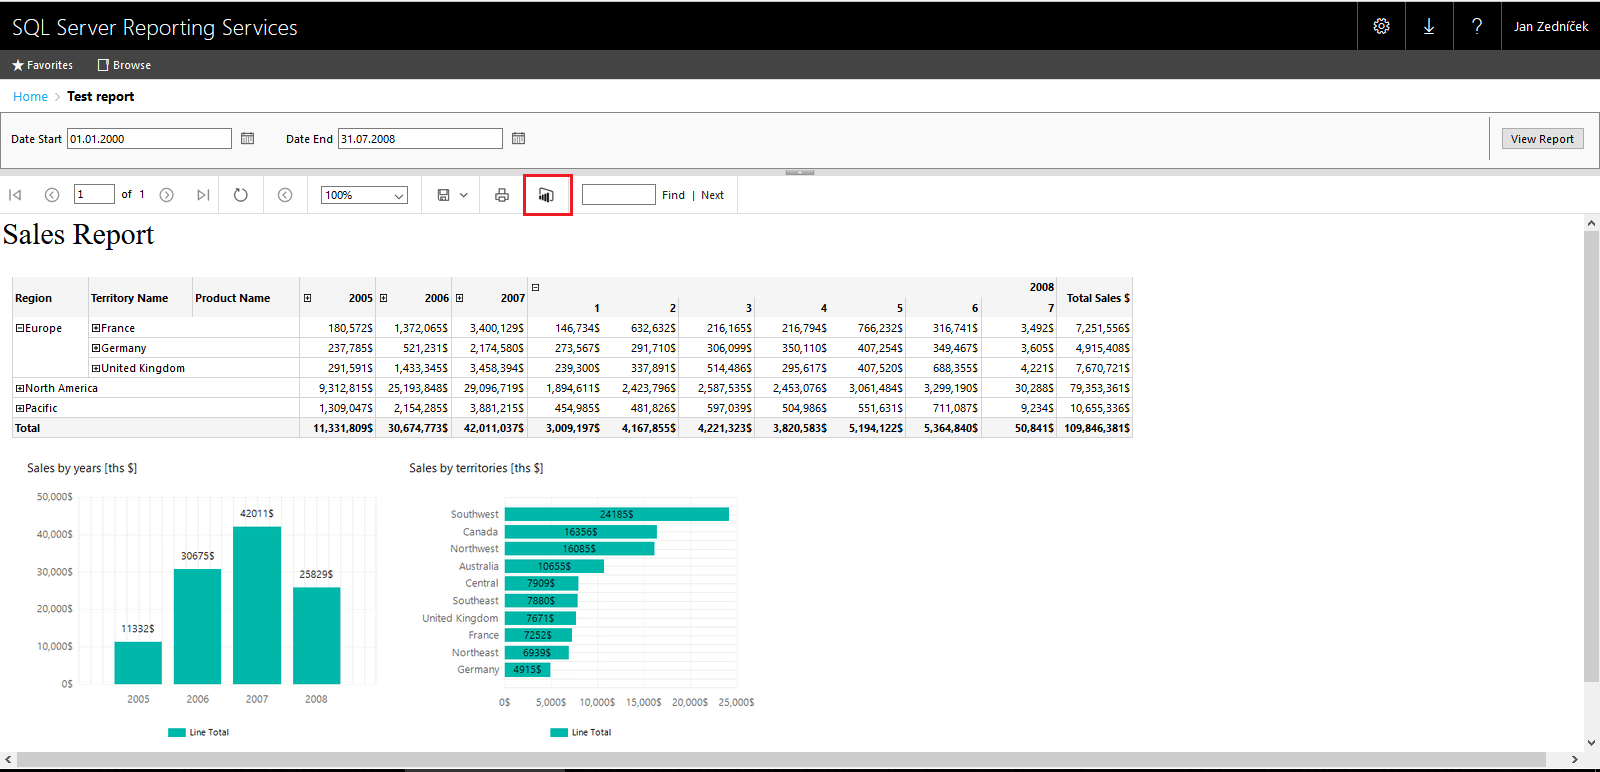
- Pin graphs to your power bi dashboard by using Power bi logo
Significantly Improved Report Visualization
Options of report visualization improved significantly. Older version of report builder and Data tools were on the level of Excel 2010 until the version SSDT2013 in the matter of visualization. Therefore SSRS reports started to be less and less favorite amongst some users.
Even the fact that SSRS reports are capable of much more in some cases did not stop raising popularity of new game changers (Power BI).