

This article is meant to be some kind of a tutorial. After going through it, it should be clearer to you how to create Power Bi report like this on your own. Following this, you can create basically any report you want – company operation report (timesheets, wages, investments), financial analytics (balance sheet, income statement, financial analysis), KPI (budget vs. actual) etc.
Are you interested in making similar report to the one below? It is not hard at all. You can display the report in fullscreen mode by clicking on the icon in the lower right corner.
The report sample is currently only available in Czech (will be revised soon)
Another interesting report which I prepared not so long ago is focused on financial reporting
Data Source – ARAD Database
ARAD database has free access and is maintained by the Czech National Bank. It consists of statistics from all economy areas – fiscal policy, monetary policy, economy figures regarding company classification by its focus and also banking information (deposits, loans etc.)
Dataset for the report is here
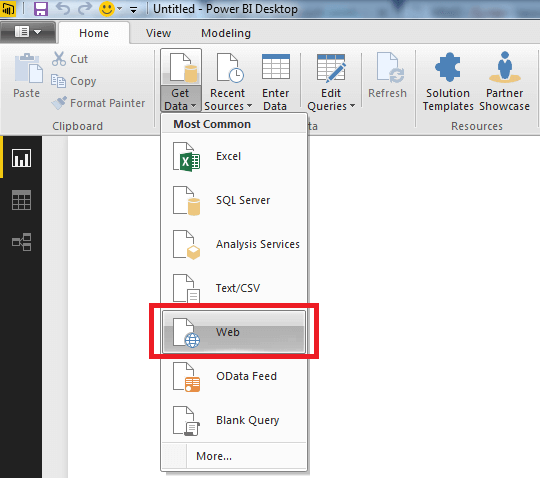
After opening Power BI desktop we click on Get Data
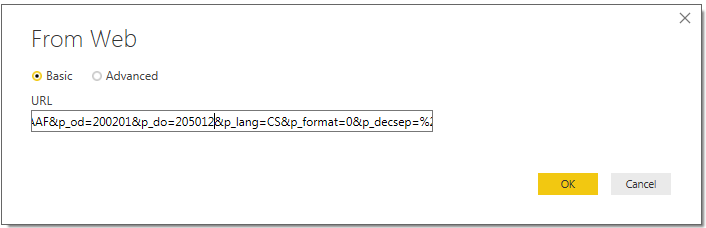
In the next step we insert URL of the source of data for ARAD database. Attention – we make a small edit in the URL (marked red). Marked number declares date till which all the data must be imported. Since we definitely do not want to edit URL after every data update on the source, we can edit the date directly. I use 205012, hence I do not need to change the URL.
URL: http://www.cnb.cz/cnb/STAT.ARADY_PKG.VYSTUP?p_period=1&p_sort=2&p_des=50&p_sestuid=19589&p_uka=1%2C2%2C3%2C4%2C5%2C6%2C7%2C8%2C9%2C10%2C11%2C12%2C13%2C14%2C15%2C16%2C17%2C18%2C19%2C20%2C21%2C22%2C23%2C24%2C25%2C26%2C27%2C28%2C29%2C30%2C31%2C32%2C33%2C34%2C35%2C36%2C37%2C38%2C39%2C40%2C41%2C42%2C43%2C44%2C45%2C46%2C47%2C48%2C49%2C50%2C51%2C52%2C53%2C54%2C55%2C56%2C57%2C58&p_strid=AAAF&p_od=200201&p_do=201701&p_lang=CS&p_format=0&p_decsep=%2C
Afterwards we only choose the table and import the data.
Edit Data For Report – The Most Important Part
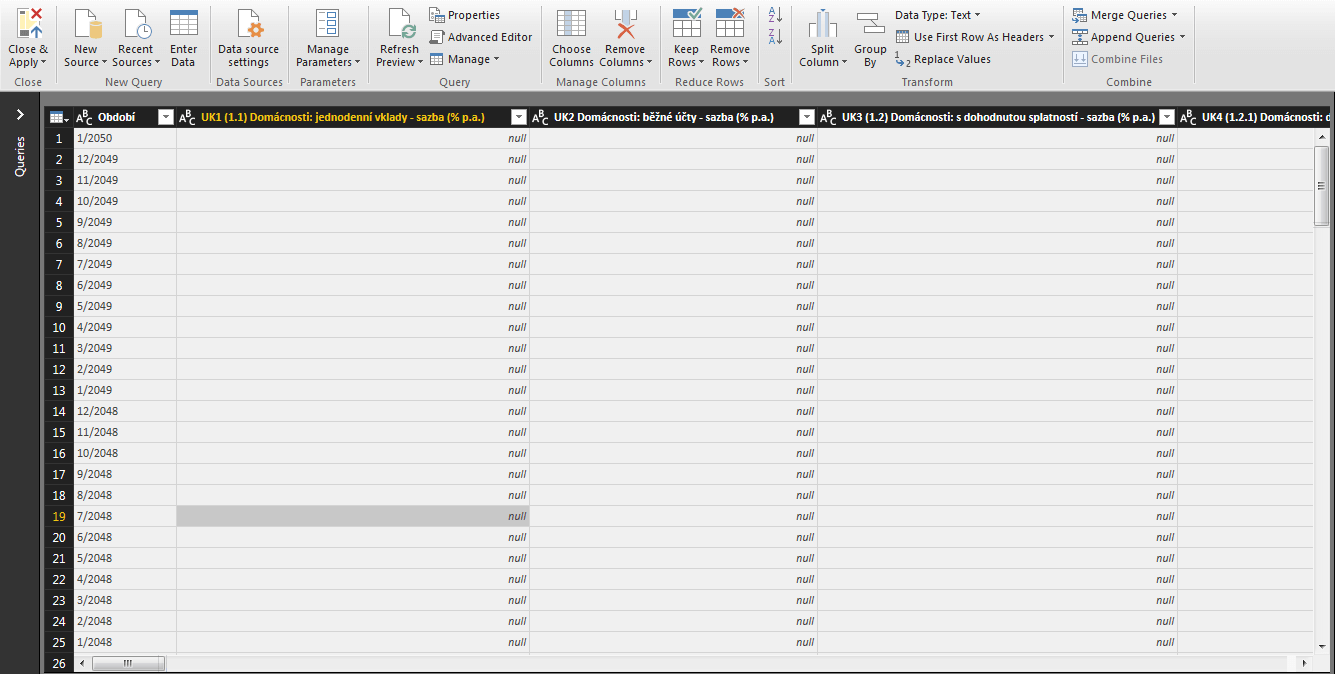
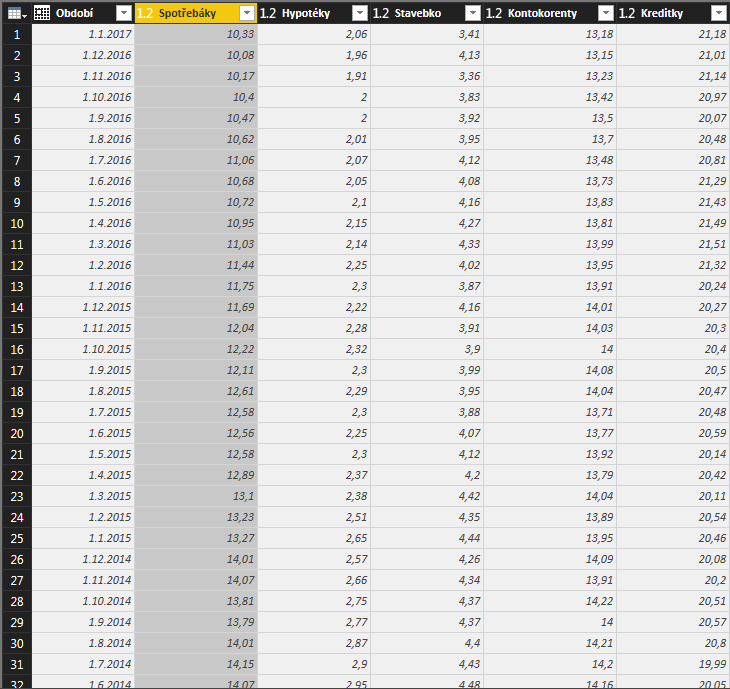
Data import into the Query editor in a form seen in the source. That means month/year is in rows and name of the marker is in columns. On top of that, empty rows will upload thanks to URL edit adjustment.
Since we forced data until the year 2050 = everything since January 2017 will be empty. We will edit the data because structure like this is not suitable for report. Data preparation is usually the most important part. Carefully processed data base offers high-quality data for the reports without any duplicities or inconsistency. This is how it looks after import:
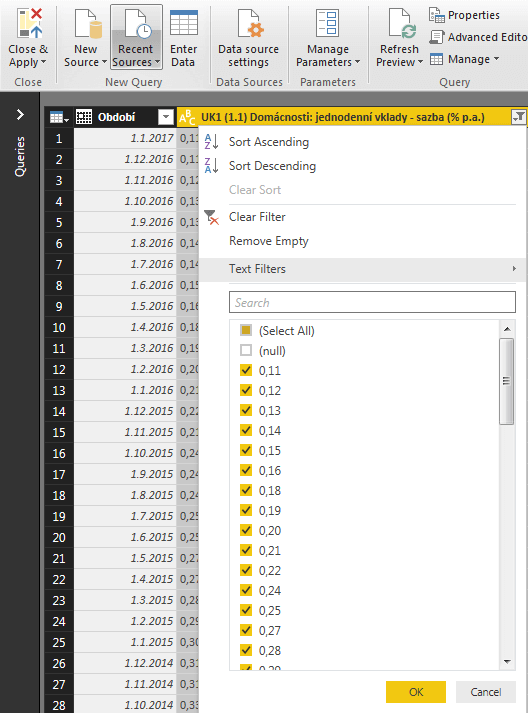
Step 1 – Filtering Non-Empty Rows
The easiest way to filter non-empty rows is by running the data through a filter. I did that with first column “Domácnosti – Jednodenní vklady”
Step 2 – Cleanup, Deleting Unimportant Data
Next thing we need to do is to edit the data in a way that the table consists only of needed information. I was interested only in data on newly provided loans. Therefore I deleted most of the columns (simply choose the column and select delete) and I left only those I am interested in. I also renamed the columns as I needed. You can rename a column by clicking on the name of the column and rewriting it.
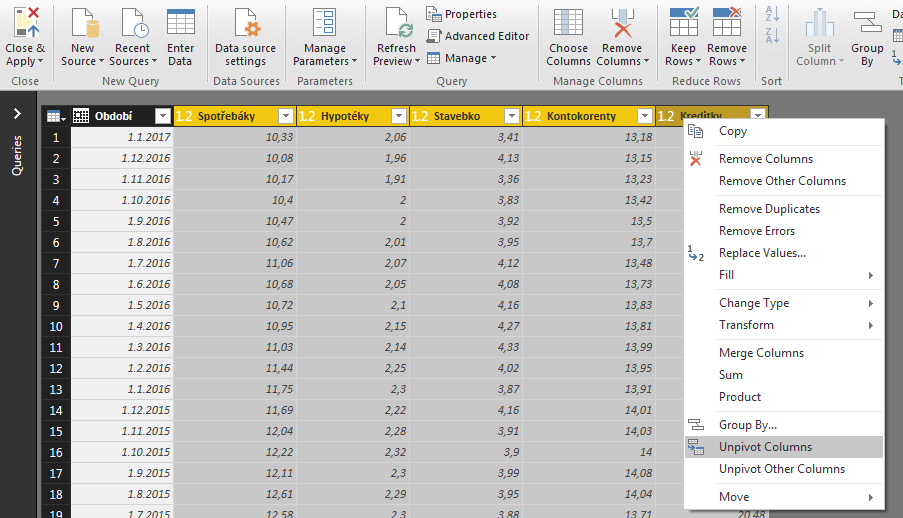
Step 3 – Unpivot Columns In Power BI Dataset
Data like this could already be used. But I did not make the final edit and that is so-called unpivot columns. It means transformation of columns into rows. Query editor provides this possibility and you can do it simply by tagging the columns – right mouse button – unpivot
Result looks like this:
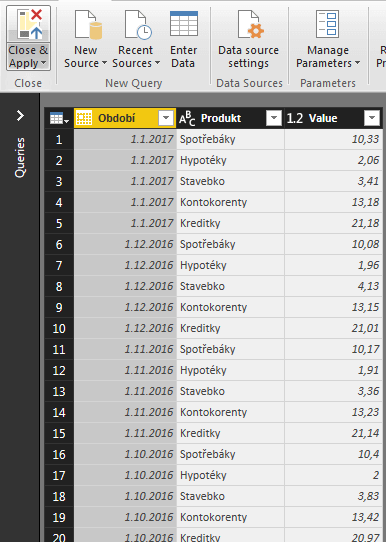
And it is done, data are ready for reporting just by these easy steps 🙂
Power BI Report Creation
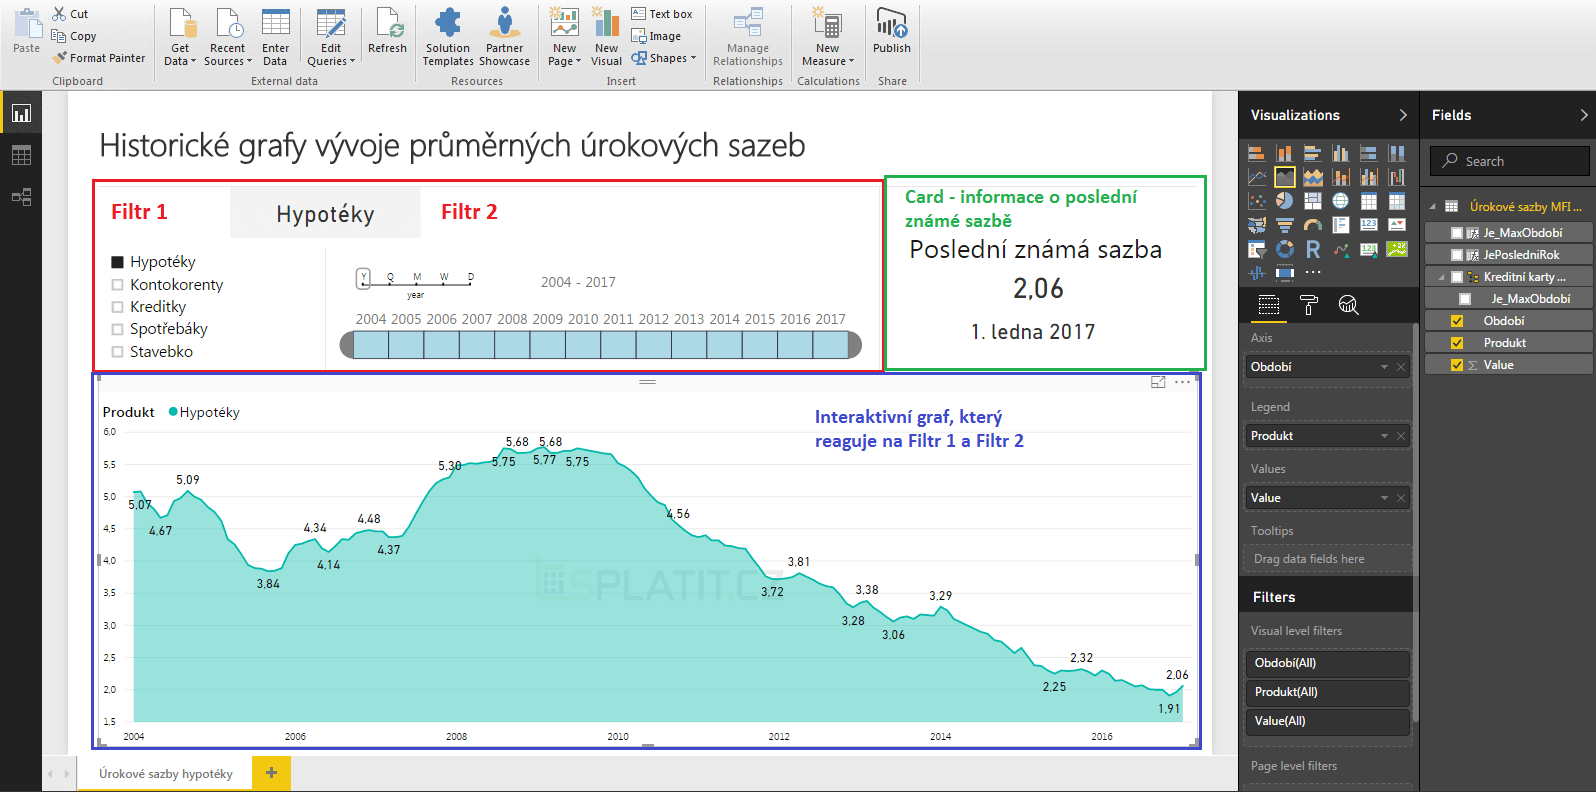
Report creation is fun given well-prepared data. You just need to play with it a little. It is important to realize what do you want to report. I wanted to give users a possibility to filter via loan type and time context. That is why I placed two filters at the top (in red). Additionally, I added information about last known interest rate into the report. Power BI report is dominated by chart reacting to both of the filters. Power is in simplicity.
Final power bi report can be simply deployed to our Power BI Account into cloud using icon publish on the upper ribbon. Then you can generate iframe with report which can be added to your web page, reporting portal or you can use and share the report using tool powerbi.com or Email.