

In this guide, we will take a look at the features that Mage.ai offers for data analysis. While this tool is primarily used for ETL pipelines, it also includes features for exploratory analysis, data statistics, and charts. With these features, you can perform initial data analysis within the tool. Mage offers a wide range of pre-defined analytical instruments, so there’s no need to write them manually.
Data Analysis, Visualization, and Exploration in Mage.ai – How and Why?
Before we start data integrations, it is necessary to analyze data for completeness and accuracy. Based on this analysis, we perform data cleaning or other actions to improve the data quality of the data source. At the end of the day, we don’t want to download dirty data!
Each visualization (graph, summary, etc.) is associated with an object (typically a block), and the visualization itself is stored in a Python file. You can find chart files in the “charts” folder (see screenshot). Currently, this folder is empty because we don’t have any graphs yet.

Types of Charts and Data Summaries in Mage-ai with an Example
Let’s try creating some analytics objects. Our data source is the AdventureWorks database as always and the Salesorderdetail table in this database. If you are wondering how to create a pipeline – we have the ETL pipeline creation process covered in the ETL | Mage.ai Pipeline – Data Load – Python, SQL Server guide.
In Mage, we have a wide range of predefined visualizations to choose from
- Charts: This group is used for the visual representation of data, such as frequency (histogram) or trend analysis over time.
- Bar chart
- Histogram
- Line chart
- and more
- Templates: This group is used for data exploration, data quality analysis, and descriptive statistics.
- % of missing values (identifying null values across columns)
- Unique values – exploring redundancy
- Most frequent values
- Summary – provides fundamental statistics, such as row count, column count, etc.
Chart and templates examples (preview)
Below you can find a few previews of pre-defined visualizations that can be further processed using Python.
A) Line chart

B) Column descriptive statistics (missing values, min, max, unique,mean, median,mode)

C) Table summary and missing values (NULL) analysis

D) Table unique values analysis of columns
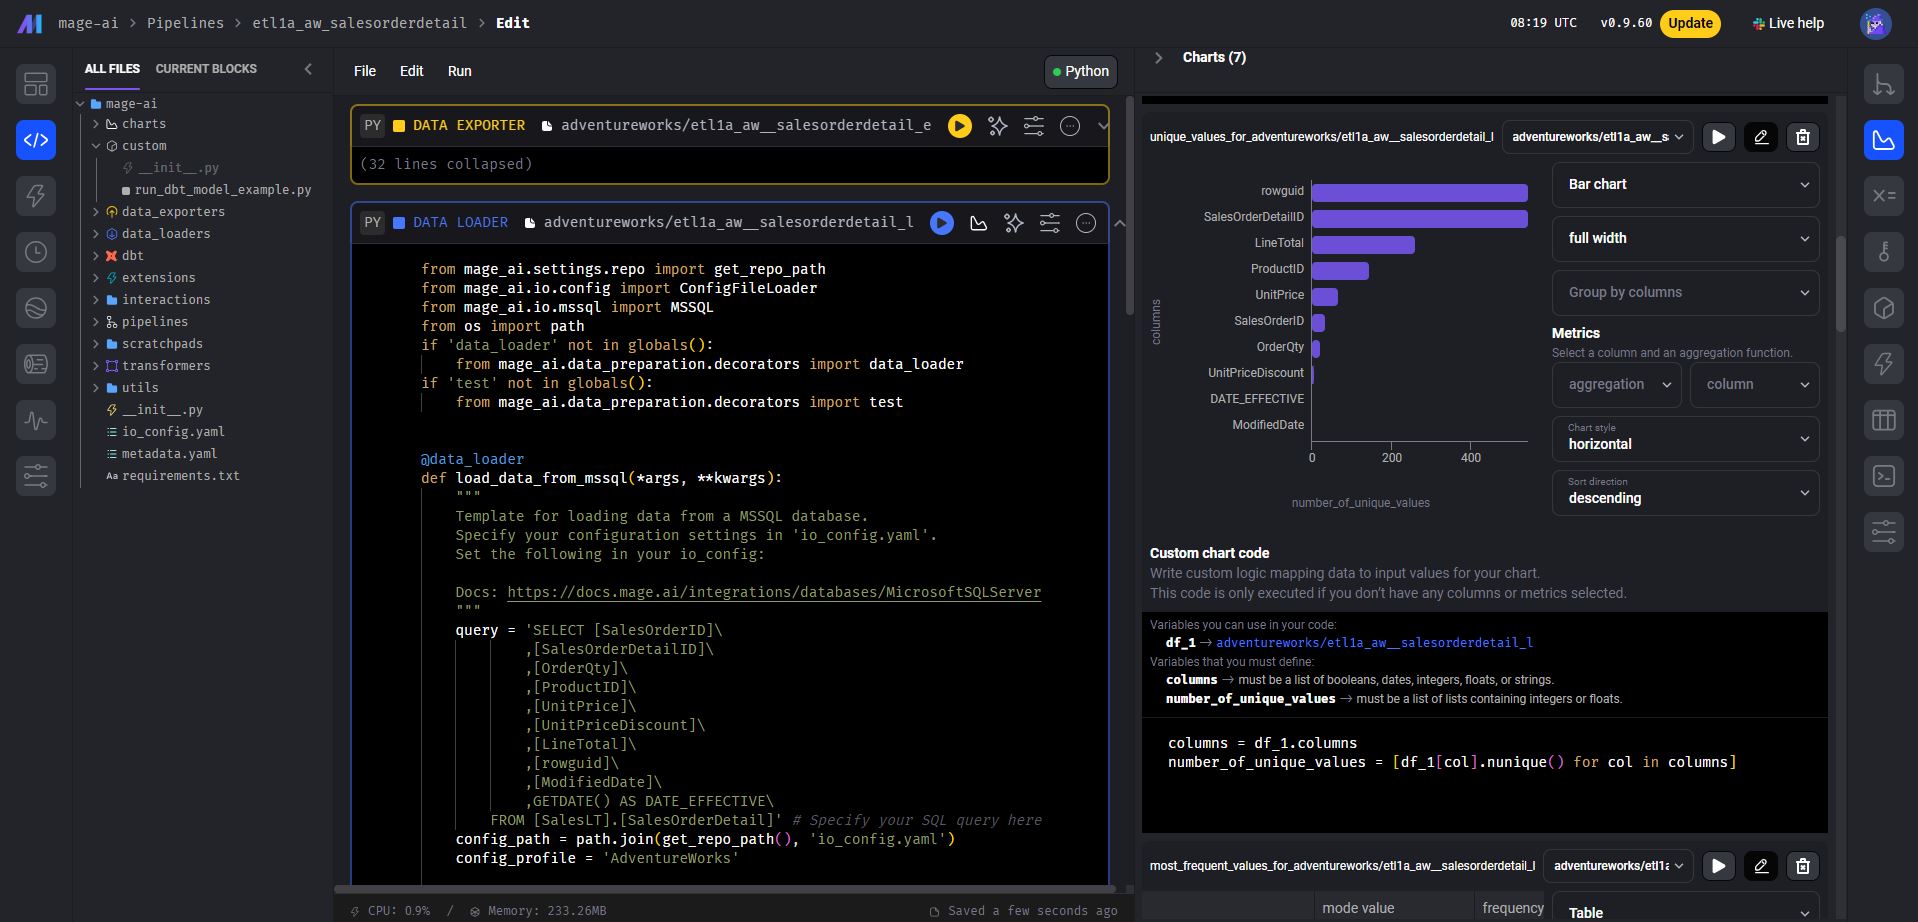
E) Most frequent values in salesorderdetail table
